Table of Contents
Introduction
Microsoft Excel is one of the most important and widely used tool in data science for quick data analysis. Even if we have other tools to handle big datasets, Excel always comes handy in day to day analytics projects for quick EDA or even making exhaustive reports.
So, we will we covering the most used Excel features by Data Scientists or Data Analysts in the analytics domain.
Table of Contents
- Basic Excel Functions
- VLook Up
- Pivot Table
- Basic Data Analysis (with Example DataSet)
- Data Science Excel Case Studies
Basic Excel Functions
Article: Check out 15 most useful Functions for Excel Data Analysis Link
Video: Excel Beginners – Complete Crash Course in 30 minutes
VLOOK UP
Similarly, HLOOK UP can be used for fetch data from rows.
Pivot Table
Part 1
P.S. Ignore the where PivotPal is being used.
Part 2:
Part 3:
Data Analysis (with Example DataSet)
The below video will cover the following Excel features:
- Using Tables
- Formulas
- Pivot Tables & Power Pivot measures
- Conditional formatting
- Charts
- Data Validation
- Keyboard Shortcuts & tricks
Bonus Video: 20 Excel Tricks for Data Analysis | Excel Tutorials
Data Science Excel Case Study
Suppose you have to complete the first cut version of Data Science Project on Excel. Let’s work on few case studies below and do full end-to-end data analysis work using Excel.
Case Study 1:
The client is a Motorcycle Shop Chain based in India. The client hired KeytoDataScience to run make a dashboard for their business team to understand their sales and ratings over the years. The below dataset contains yearly sales data for accessories, bikes, clothing and bike components.
Task:
Provide an overview of the motorcycle’s sales by the following attributes:
- Total yearly sales across all categories
- Year-on-year total sales and average rating
- Year-on-year change in sales and average rating
Output:
Create an Excel Dashboard on showing the overview of the motorcycles sales and ratings.
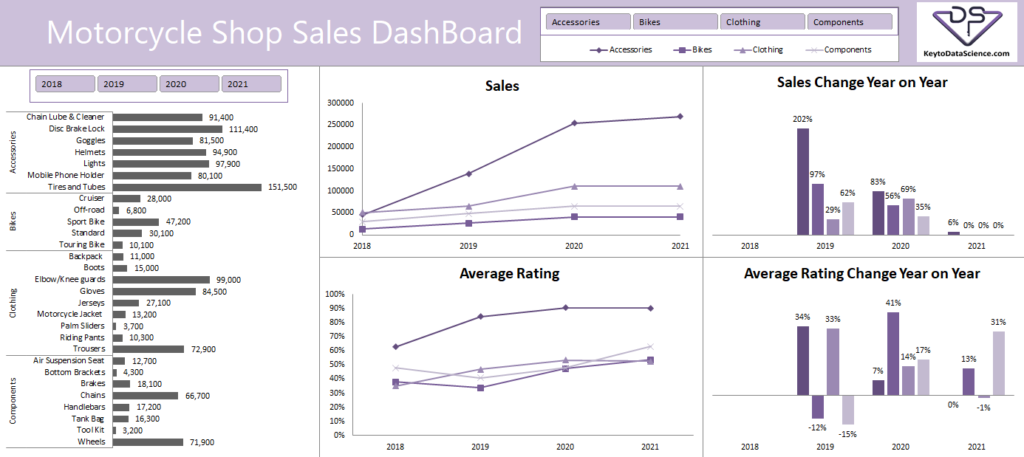
Please include a section on highlighting the insights you can generate by observing the dashboard.
Case Study 2:
The client is a leading Fashion retailer in Australia. The client hired KeytoDataScience to run a display advertising campaign for their brand, and shows ads to users leading them to make a purchase on the brand’s website. The given dataset is the Sales data for all users who made a purchase online in the first half of October ’21.
Task:
Provide an overview of the brand’s sales by the following attributes:
- Overall – Total Sales and Revenue in the given time period
- Basket – Avg. unique quantity, revenue per order
- Attributes – Time of Day, Day of Week, Geography, Payment Type, Gender
- Frequency – How many are single/multiple purchasers? What is the frequency of multi-purchase? Any typical attributes?
Output:
Create a Excel Dashboard/Report on your findings covering the overview of the brand’s sales performance.
Please include a section on how would you broadly go about targeting more users for this brand. Come up with a well-defined media strategy.